
Information Charts
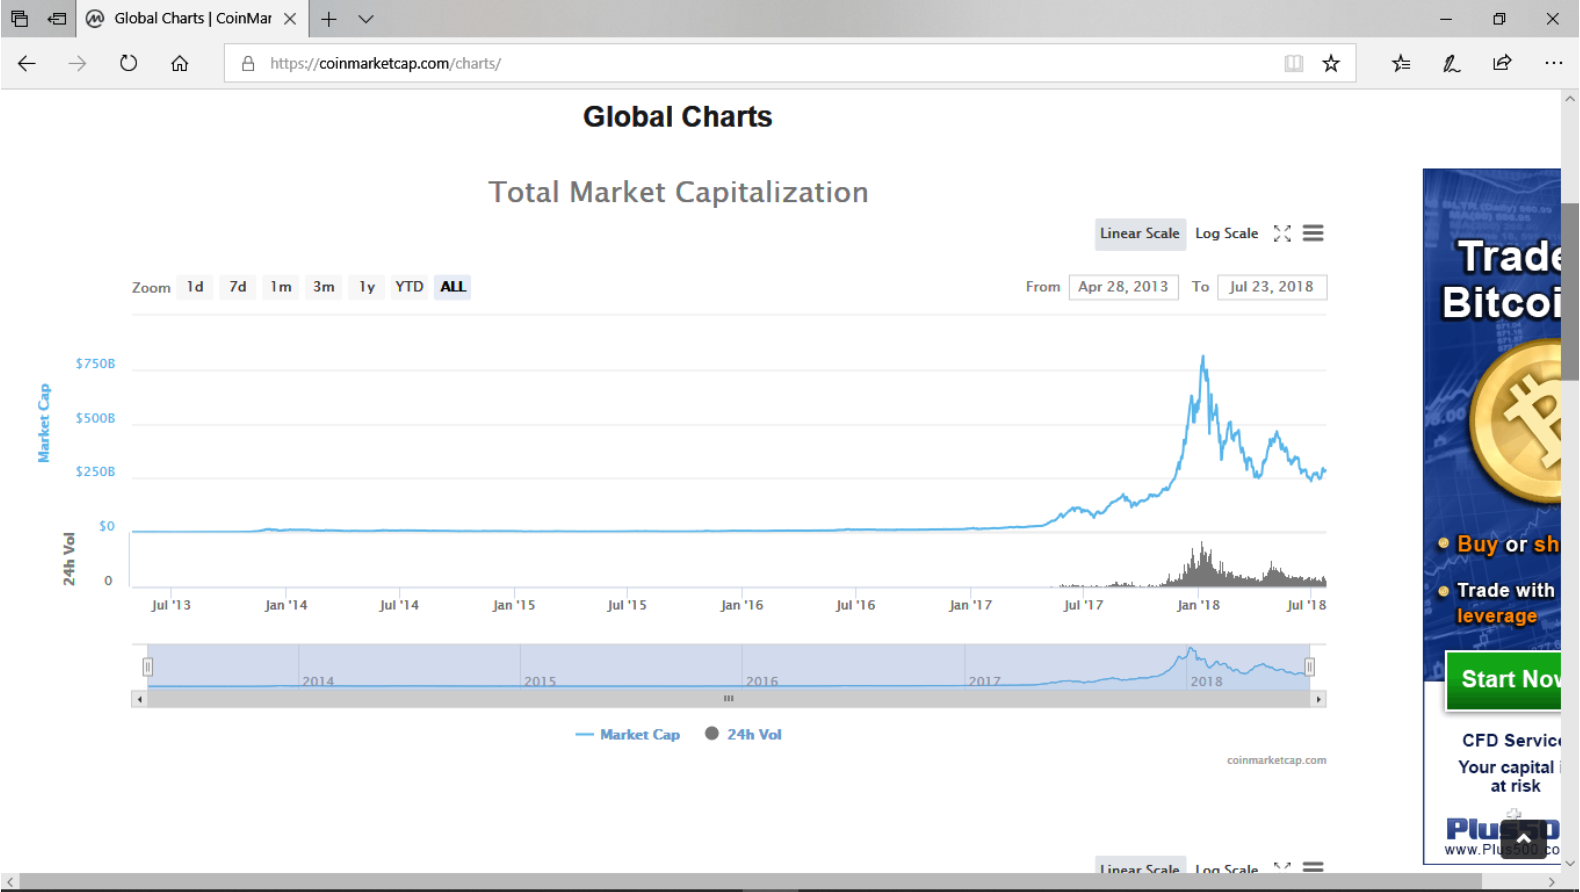
To find information and the price of specific crypto assets and the general market the best place to bookmark is CoinMarketCap.
![]()
Here you can view the ‘Total Market Capitalization’ which is the value of all crypto assets added together and gives an overview of how the total value of the entire market has moved over your selected timeframe.
Coin Market Cap lists all crypto assets in order of their market share (value) as well as giving you the current price and percentage gains & losses and the past 24hr trading volume.
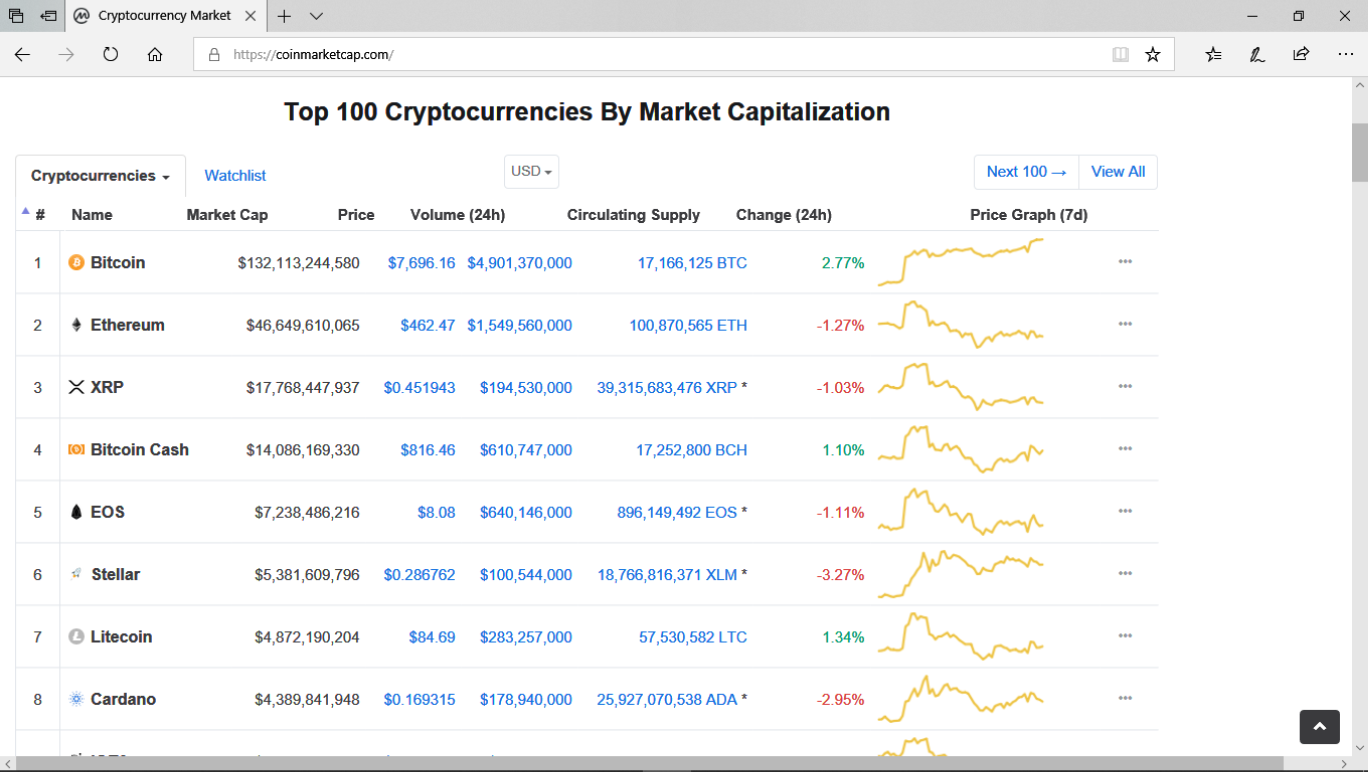
You can then select specific crypto assets to find out more information on them such as the circulating and maximum supply, on which exchanges it is traded, historical data and links to further resources and further information on that crypto asset.
Those crypto assets in the higher positions are usually more established and could be deemed as the most successful to date, which explains why Bitcoin is number 1. The further you go down the list the lower value and market share of that crypto asset and potentially the greater risk you are taking investing in less established and proven crypto assets. The number on this list currently exceeds 5000, up from 1500 just two years ago.
Trading Charts
At Dragon Bitcoin we really do not recommend that you trade unless you are already an experienced trader with a background in FOREX/CFD/Stocks trading. Buying low and selling high sounds easy but there are a wealth of emotional, educational and experience issues to take into account. Bitcoin is one area of knowledge and trading is a separate area entirely requiring a huge amount of time to educate yourself and gain experience as it is incredibly easy to lose everything.
An often quoted statistic is that only 5% of traders are successful.
However, if you want to invest in Bitcoin then it can be a good idea to get a grasp of the basics so as to enable you to choose a good time to invest. The best resource for trading charts is Trading View.
![]()
Here you can select a pair such as BTC/USD and view the price movements over your selected timeframe and add indicators to your chart for technical analysis.
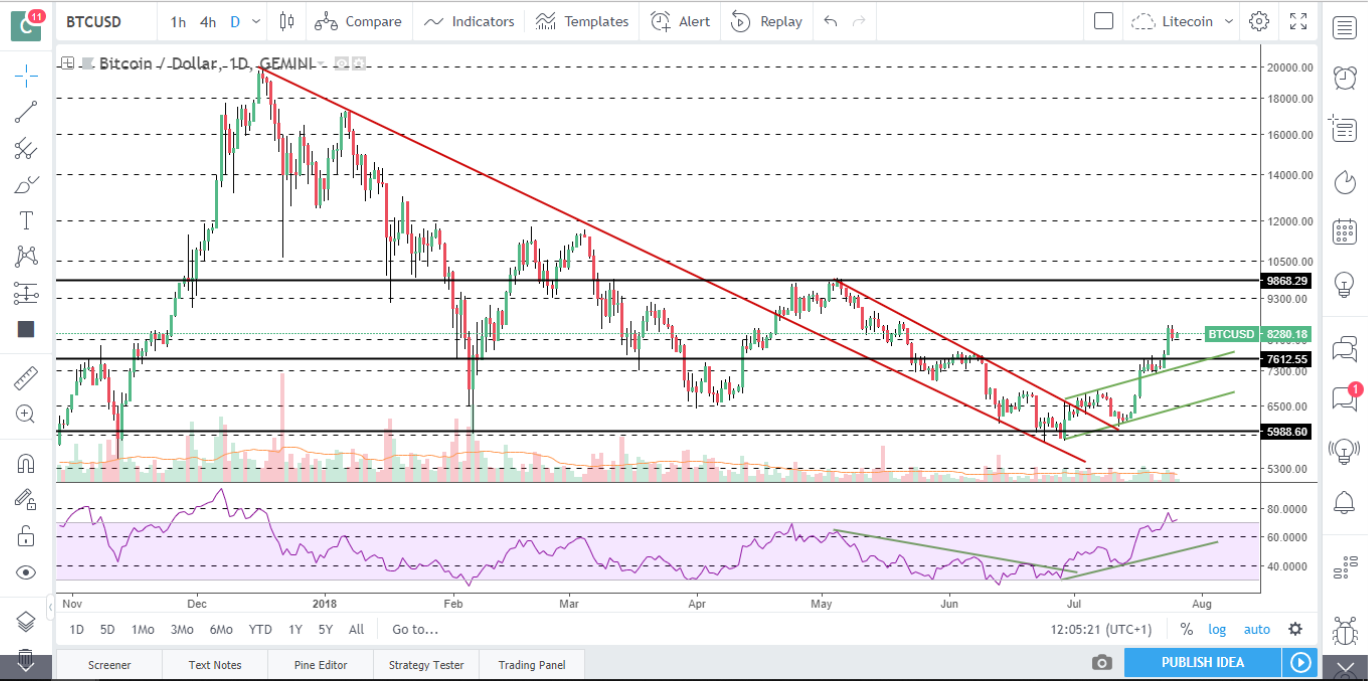
Some of the tools and indicators that need to be learnt for the technical analysis of trading charts are:
Timeframes
Candlesticks
Candlestick patterns
Trend lines
Horizontal support & resistance areas/lines
Volume
Moving Averages
Relative Strength Index (RSI)
and there are many, many more indicators to chose from!
Please watch this YouTube video for a good explanation of the basics:

A great resource to learn more about trading is Babypips. All of the information required to educate yourself on trading is available online free of charge.
You will come across many offers of paid for trading training courses and we recommend you stay away from them all. There are many trading signal providers as well all over social media; never take these signals whether free or paid for. Always ask why would a successful trader sell signals or training if they can profitably trade themselves? 90%+ of them are scams.
We cannot emphasise enough how important it is to not trade unless you are experienced, predicting where the price will go in the short term is incredibly hard in the volatile crypto markets. Some of the people that have gained most financially from Bitcoin are those that invested and did not trade but just held their crypto medium term through the volatile markets so it can be a successful strategy to never trade.
Never invest more than you can afford to lose.